
Overview
As a chemical engineering graduate, designing a process for a chemical plant is one of my strengths. It's also I developed with taking an e-course to strengthen my abilities.
Based on my experiences, I love re-designing the process I was working for. I used Microsoft Visio for designing BFD, PFD, and P&ID. But for more 3D and complex design, I usually do it with AutoCAD.
Process Design
Background
Process design is the final stage for developing a process in any industry. The final output of process design are BFD, PFD, P&ID, and detailed design.

Process design is a series of steps for defining the process, the equipment, instruments, building, and the other supporting component to solve the problem. From its several diagram design, we knew the process, equipment, and components needed to easier the team according to their respective fields. Hence, it's important to design a clear and specific flow diagram for each section. Following are the advantages of making or updating a flow diagram:
-
Optimization Process. We can evaluate the current process periodically based on the flow diagram given and then decide which section is no longer relevant.
-
Knowledge Transfer. A clear process diagram will easier the knowledge transfer to the young generation, and then they will continue the plant process production with less risk.
-
Minimize the Incidents. Misunderstanding the equipment process is one of the reasons incidents happened, with a clear process diagram, everyone in the team has the same understanding of the processes.
-
Safety & Health. The more serious impact which is caused by misunderstanding the process is an accident. It will be dangerous for the team that works related to the process/equipment/instrument.
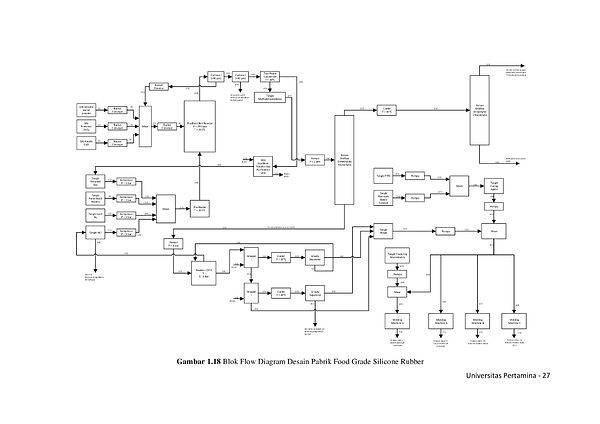
The Block Flow Diagram (BFD) has the purpose of illustrating the logical flow of the processing phases of the product, highlighting the processing sequence, their concatenations, and the types of the section of the process. Generally, each block represents a treatment unit of the process plant.
Block Flow Diagram
Process Flow Diagram
The Process Flow Diagram examines the single unit or the plant itself, and it represents the main equipment, the connections between them (pipes), highlights the main tools (equipment, instruments, and valves), and the essential settings for a correct operation and correct management of the plant itself, as the following nominal operate conditions:
-
Flow
-
Pressure
-
Temperature
-
Chemical Composition
Process Flow Diagram of PET Chip Processes

Process & Instrument Diagram
The Process & Instrumentation Diagram is the logical continuation of the flow scheme because the latter is supplied with all the information necessary for the construction and operability of the plant. Each specialized engineering unit completes and develops, using internationally recognized symbology (for Example, ISA S series 5), the parts of its competence by inserting in the scheme:
-
Data and characteristics of the equipment
-
Numbering and Classification of Pipes
-
Instrumentation in the control room
-
Instrumentation and valves in the field
-
Construction and installation notes.